 For years I worked with some sort of paper construction/production schedule. Most of them, were not all that sophisticated. The rub with this type (paper) of construction schedule for many builders/contractors is that by the time they are copied/printed they are already inaccurate and obsolete.
This leads to frustration and a general feeling of “why bother?” on the part of those who were intended to use them.
” In preparing for battle I have always found that plans are useless, but planning is indispensable.” Dwight D. Eisenhower
In applying this quote; schedules, like battle plans, need to be able to account for changes that are always occurring. The middle ground between a paper schedule and a dedicated scheduling program could be a MS Excel Gantt-type schedule.
The good
- most people have a comfort level with MS Excel
- you probably already have the program
- you can add notes
- easily add/delete tasks
- easily adjust dateline
- easy to see tasks that are behind schedule
- track planned vs. actual start
- track planned vs. actual duration
- track completion percentage
- several sort possibilities
The not so good
- no critical path
- cannot create phases and milestones
- few different views of data
- no task relationships or dependencies
- difficult to compare multiple versions of the schedule
- cannot analyze pay application/draw details
- limited report possibilities
(If you are looking for something more sophisticated, check out my post on MS Project. If you just need a timeline, try Office Timeline click the buttons below for more details)
Project Schedule 2016:
- Covers one calendar year and 100 tasks.
- (You may find it helpful to shade non-work dates)
Project set up:
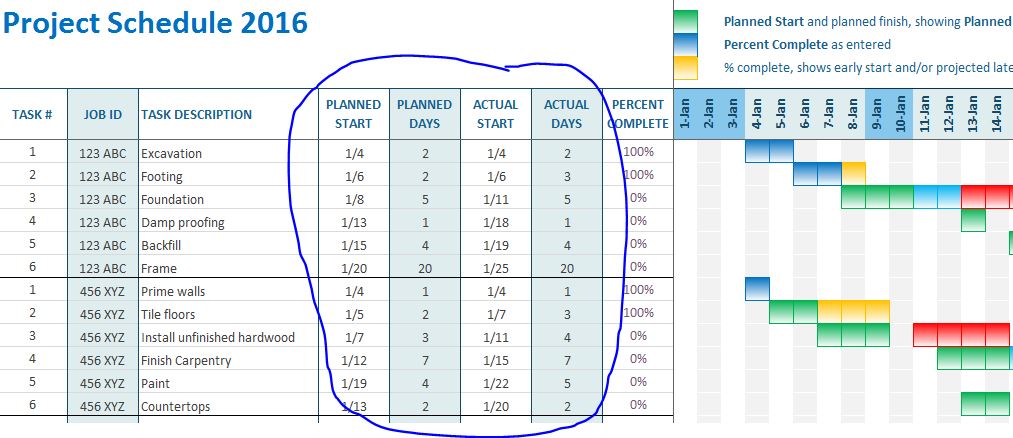
- Define the tasks for your project
- Input your Planned Start, Planned Days information for each task.
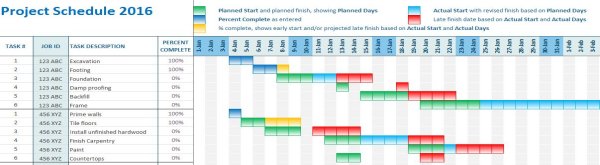
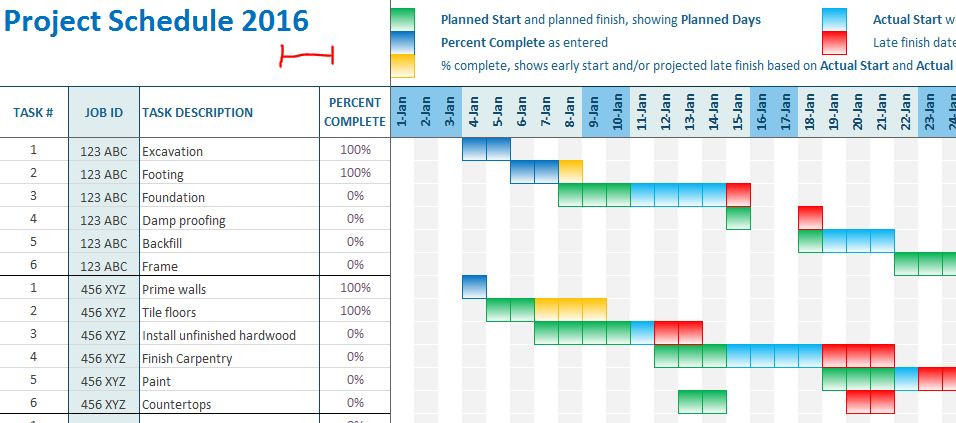
- The chart develops automatically (in green) as you enter data
Updating the project:
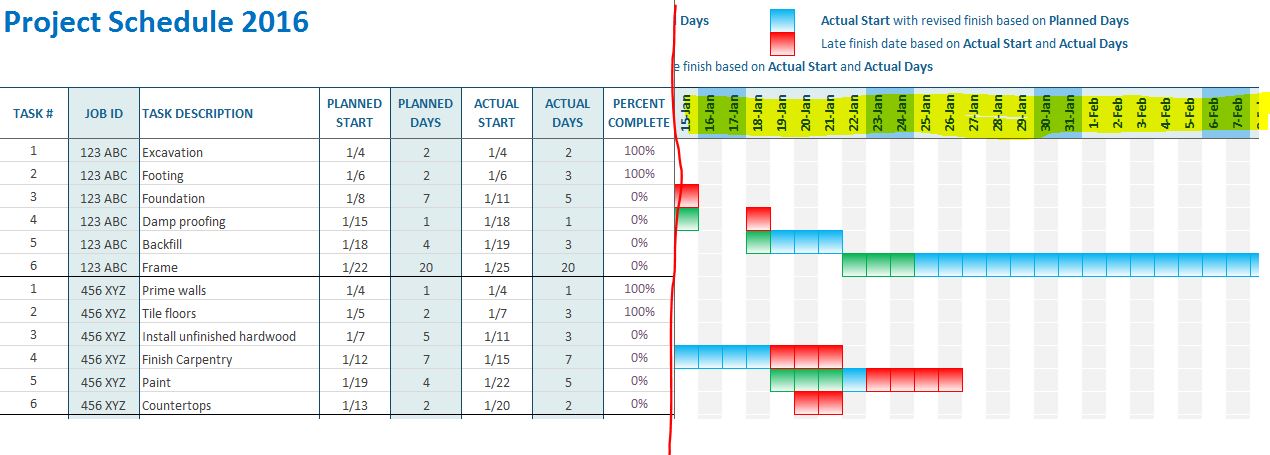
- As percent complete is updated, blocks turn dark blue. (longer tasks will more accurately represent the % complete) When a task is 100% complete, cells will turn yellow if the task finishes past its planned finish. This helps you see where time was lost.
- As Actual Start, Actual Days are updated cells will turn light blue or red. Light blue represents the Actual Start with revised finish based on original Planned Days. Red represents how far past the original plan you will be if nothing else changes.
- Pay close attention to the red cells because you may still have a chance to reduce or eliminate them by working with those responsible for the task.
Example:
Click on image(s) to enlarge
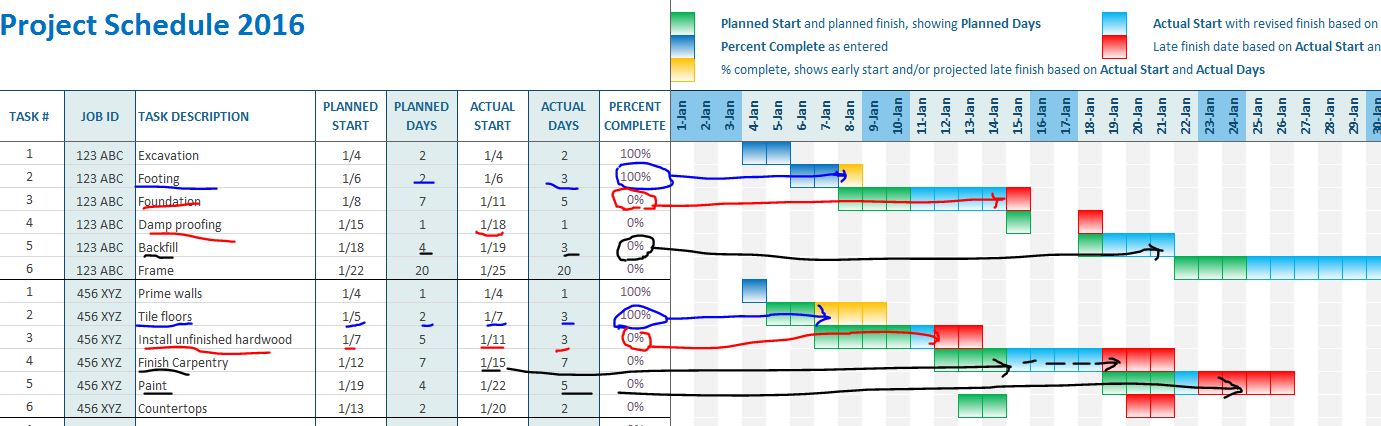
Job 123 ABC
- footings (blue pen) are 100% complete, but it took 3 days instead of 2. The extra day is shown in yellow
- foundations and damp proofing (red pen) will have to start later than planned. If nothing changes, the foundation and damp proofing will finish 1 day behind. There is always the possibility of finishing the foundation 1 day early, and the project will be back on track.
- The contractor responsible for Backfill can finish a day early, putting the project back on schedule.
- The framing contractor will be starting three days late.
Job 456 XYZ
- the walls are primed on time, but the Tile install (blue pen) started 3 days late and took an extra day. This puts the project 3 days behind.
- Tile install pushes the Hardwood install (red pen) and Finish Carpentry (black pen) behind.
- the Finish Carpentry is expected to start late which pushes the Paint schedule out. The project could get out of hand very quickly if adjustments are not made immediately.
More screen shots:
Show input/update details:
Hide input/update details:
Show/hide “Responsibility” column

Scroll “up” through jobs and tasks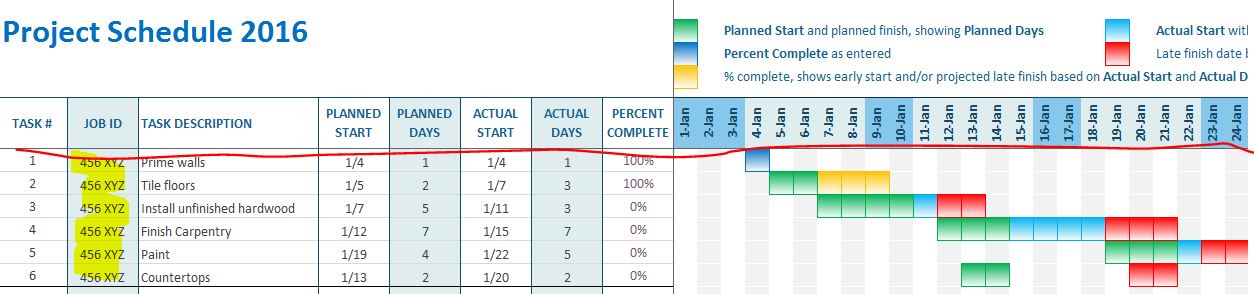
Scroll “right” through the dateline